Current Benchmark Coverage
Application Domain Distribution
Complexity Level Distribution
Note: Operation count represents the sum of all visualization operations across all test cases.
Data Type Distribution
Note: A case can have multiple data type tags
Visualization Operation Distribution
Note: A case can have multiple operation tags.
Browse Test Cases
Filter and explore all 108 test cases in the benchmark
Application Domain
Complexity Level
Data Type
Visualization Operation
| Case Name | Application Domain | Data Type | Complexity Level | Visualization Operations |
|---|---|---|---|---|
| Loading test cases... | ||||
Contribute Test Case
Help build a comprehensive benchmark for scientific visualization agents. Contribute a test case by submitting the dataset along with task descriptions and evaluation criteria.
📁 File Upload
Files are uploaded to Firebase Cloud Storage. All submissions are stored securely and will be used for the SciVisAgentBench benchmark.
- Maximum data size: < 5GB per dataset
- Ground truth images: PNG, JPG, TIFF, etc. (minimum 1024x1024 pixels recommended)
- Supported source data formats: VTK, NIfTI, RAW, NRRD, HDF5, etc.
SciVisAgentBench: A Benchmark for Evaluating Scientific Data Analysis and Visualization Agents
News
- 06/03/2026 Docker Evaluation Environment: Agents can now run inside a containerized environment bundling the full visualization toolchain (ParaView, napari, VTK, TopologyToolKit, MDAnalysis, and more), isolated from the local filesystem and ground truth for safe and trustworthy evaluation.
- 02/03/2026 Easy Evaluation Framework: A new lightweight framework lets you evaluate any agent by implementing a single method, replacing complex 500+ line test runners.
What is SciVisAgentBench?
SciVisAgentBench is a comprehensive evaluation framework for scientific data analysis and visualization agents. We aim to transform SciVis agents from experimental tools into reliable scientific instruments through systematic evaluation.
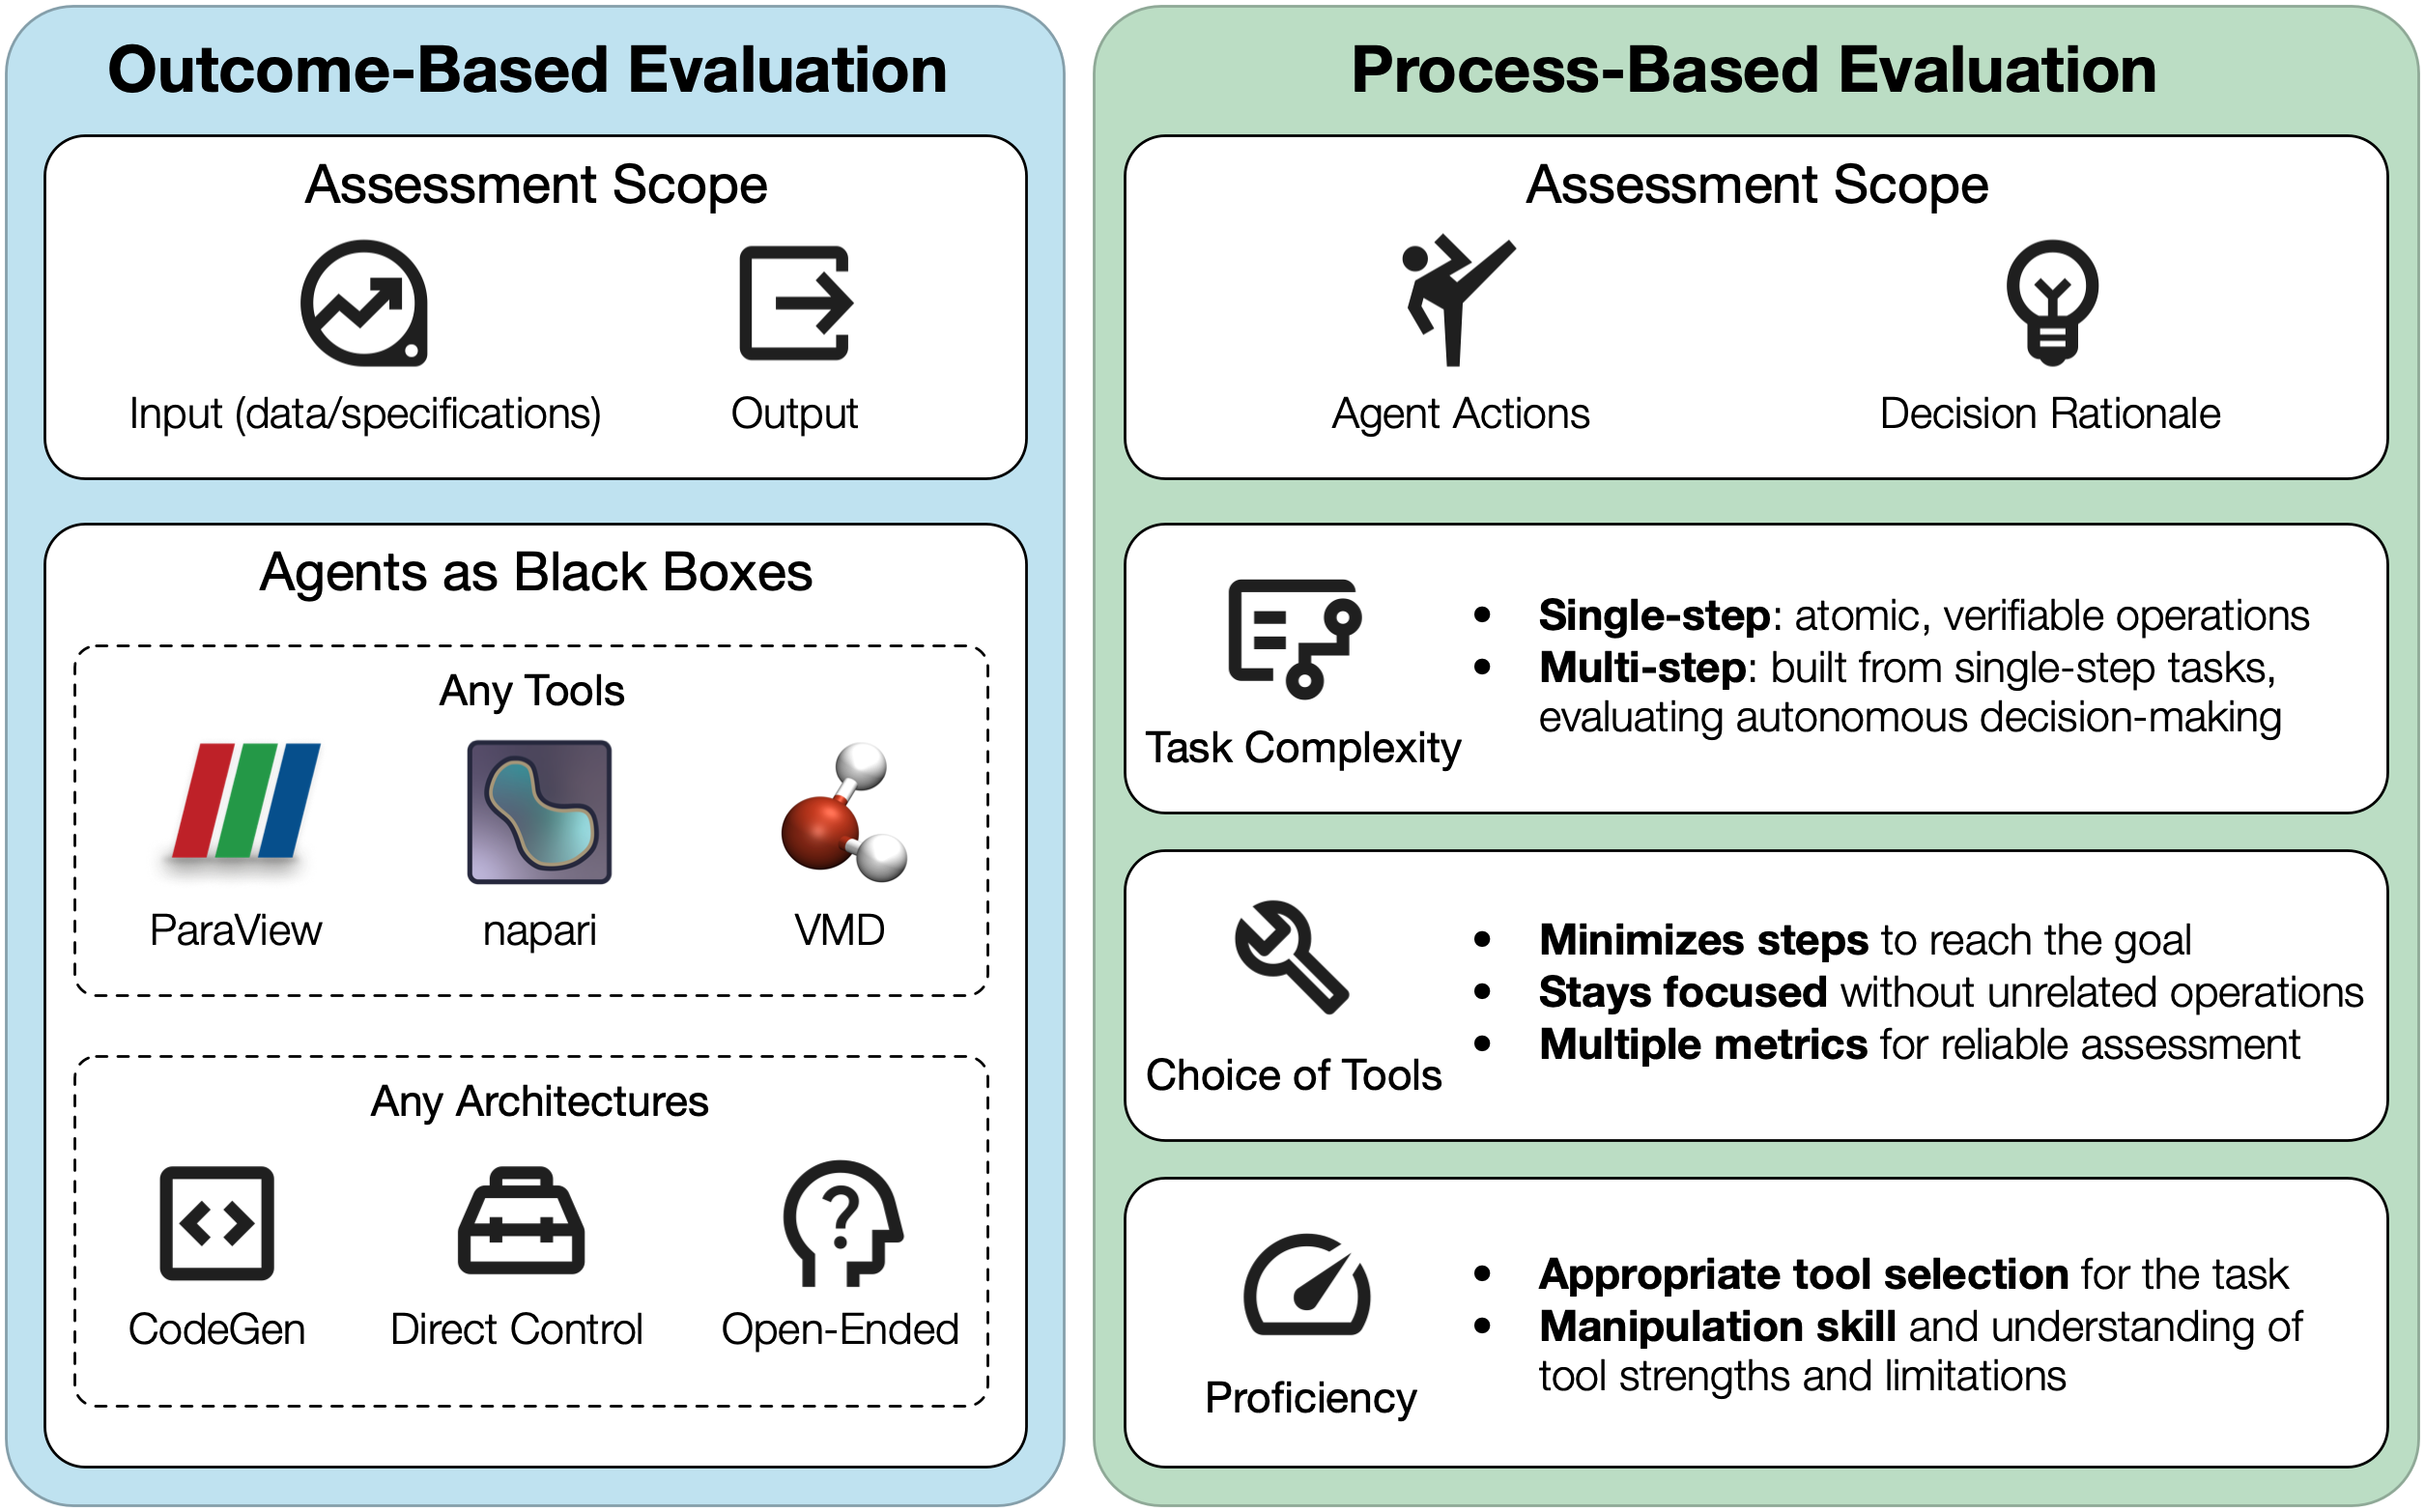
Taxonomy of SciVis agent evaluation, organized into two perspectives: outcome-based evaluation assessing the relationship between input specifications and final outputs while treating agents as black boxes, and process-based evaluation analyzing the agent's action path, decision rationale, and intermediate behaviors.
Why Contribute?
- Help establish standardized evaluation metrics for visualization agents
- Drive innovation in autonomous scientific visualization
- Contribute to open science and reproducible research
- Be recognized as a contributor to this community effort
Evaluation Taxonomy
Our benchmark evaluates agents across multiple dimensions, including outcome quality, process efficiency, and task complexity. We combine LLM-as-a-judge with quantitative metrics for robust assessment.
Visit our GitHub repository for deployment guidance, and the examples page for evaluation examples.