Current Benchmark Coverage

137 Test Cases
8 Application Domains
5 Data Types
15 Visualization Operations

Application Domain Distribution

๐Ÿงฌ
Biology
38 cases
(27.7%)
โšก
Physics
38 cases
(27.7%)
๐Ÿ”ฌ
Others
17 cases
(12.4%)
๐Ÿงช
Chemistry
16 cases
(11.7%)
๐Ÿฅ
Medical Science
14 cases
(10.2%)
๐Ÿ“
Mathematics
13 cases
(9.5%)
๐Ÿ”ญ
Astronomy
5 cases
(3.6%)
๐ŸŒ
Earth System Science
3 cases
(2.2%)

Complexity Level Distribution

Task 100 (73.0%)
Workflow 37 (27.0%)
Total Operations 632

Note: Operation count represents the sum of all visualization operations across all test cases

Data Type Distribution

Scalar Fields 97
Multi-variate 42
Vector Fields 21
Time-varying 13
Tensor Fields 2

Note: Cases can have multiple data type tags

Visualization Operations Distribution

Color & Opacity Mapping Assign colors, opacity, or textures to data elements 95
Surface & Contour Extraction Generate isosurfaces, contour lines, ribbons, or tubes 66
Volume Rendering Render volumetric data directly using ray casting or splatting 55
View & Camera Control Adjust camera position, orientation, zoom, or lighting 41
Field Computation Derive new scalar, vector, or tensor fields from existing data 29
Data Subsetting & Extraction Isolate spatial regions or value-based subsets from a dataset 23
Scientific Insight Derivation Interpret results to answer domain-specific questions 19
Glyph & Marker Placement Place oriented, scaled, or typed glyphs at data points 17
Dataset Restructuring Combine, partition, or reorganize multiple datasets 15
Temporal Processing Perform computations involving the time dimension of data 12
Feature Identification & Segmentation Detect, extract, or label discrete structures or regions 7
Data Smoothing & Filtering Reduce noise, enhance features, or apply statistical filters 5
Plot & Chart Generation Produce 2D statistical plots, histograms, or line charts 3
Data Sampling & Resolution Control Modify data density or sampling resolution for efficiency 2
Geometric & Topological Transformation Modify the geometry or connectivity structure of a dataset 2

Note: Cases can have multiple operation tags

Browse Test Cases

Filter and explore all 137 test cases in the benchmark

Application Domain

Complexity Level

Data Type

Visualization Operations

Showing 137 of 137 cases
Case Name Application Domain Complexity Level Visualization Operations Data Type Operation Count
Loading test cases...

Pending Contributions

Track new submissions awaiting review and incorporation into the benchmark. These statistics reflect contributions not yet included in the official benchmark above.

0 Datasets
0 Contributors
0 Test Cases

Pending Contributions Breakdown

Application Domains

Attribute Types

Contributors

Contributor Institution # of Questions Subjects
No contributions yet. Be the first to contribute!

Submit Dataset

Help build a comprehensive benchmark for scientific visualization agents. Submit your dataset along with task descriptions and evaluation criteria.

๐Ÿ“ About File Uploads

Files are uploaded to Firebase Cloud Storage. All submissions are stored securely and will be used for the SciVisAgentBench benchmark.

  • Maximum data size: < 5GB per dataset
  • Ground truth images: PNG, JPG, TIFF, etc. (minimum 1024x1024 pixels recommended)
  • Supported source data formats: VTK, NIfTI, RAW, NRRD, HDF5, etc.

Contributor Information

Dataset Information

Application Domain (Data Source)

Attribute Types *

What information does the data represent?

Task Description for LLM Agent *

File Uploads *

Any format accepted: VTK, NIfTI, RAW, NRRD, HDF5, etc. Multiple files allowed (Max size: 5GB recommended per file)
Optional: Any format accepted (e.g., ParaView state file, or state files of other visualization engines). Multiple files allowed
Optional: Any format (JSON, YAML, TXT, etc.). Multiple files allowed

Outcome-Based Evaluation Metrics *

Any format accepted: PNG, JPG, TIFF, etc. Upload multiple views of the expected visualization
Optional: Any format accepted (e.g., Python, ParaView, Jupyter Notebook, MATLAB, R, or other visualization code). Multiple files allowed
Optional: Enter the correct answers to any questions in the task description

Additional Information

About SciVisAgentBench

What is SciVisAgentBench?

SciVisAgentBench is a comprehensive evaluation framework for scientific data analysis and visualization agents. We aim to transform SciVis agents from experimental tools into reliable scientific instruments through systematic evaluation.

Taxonomy of SciVis agent evaluation

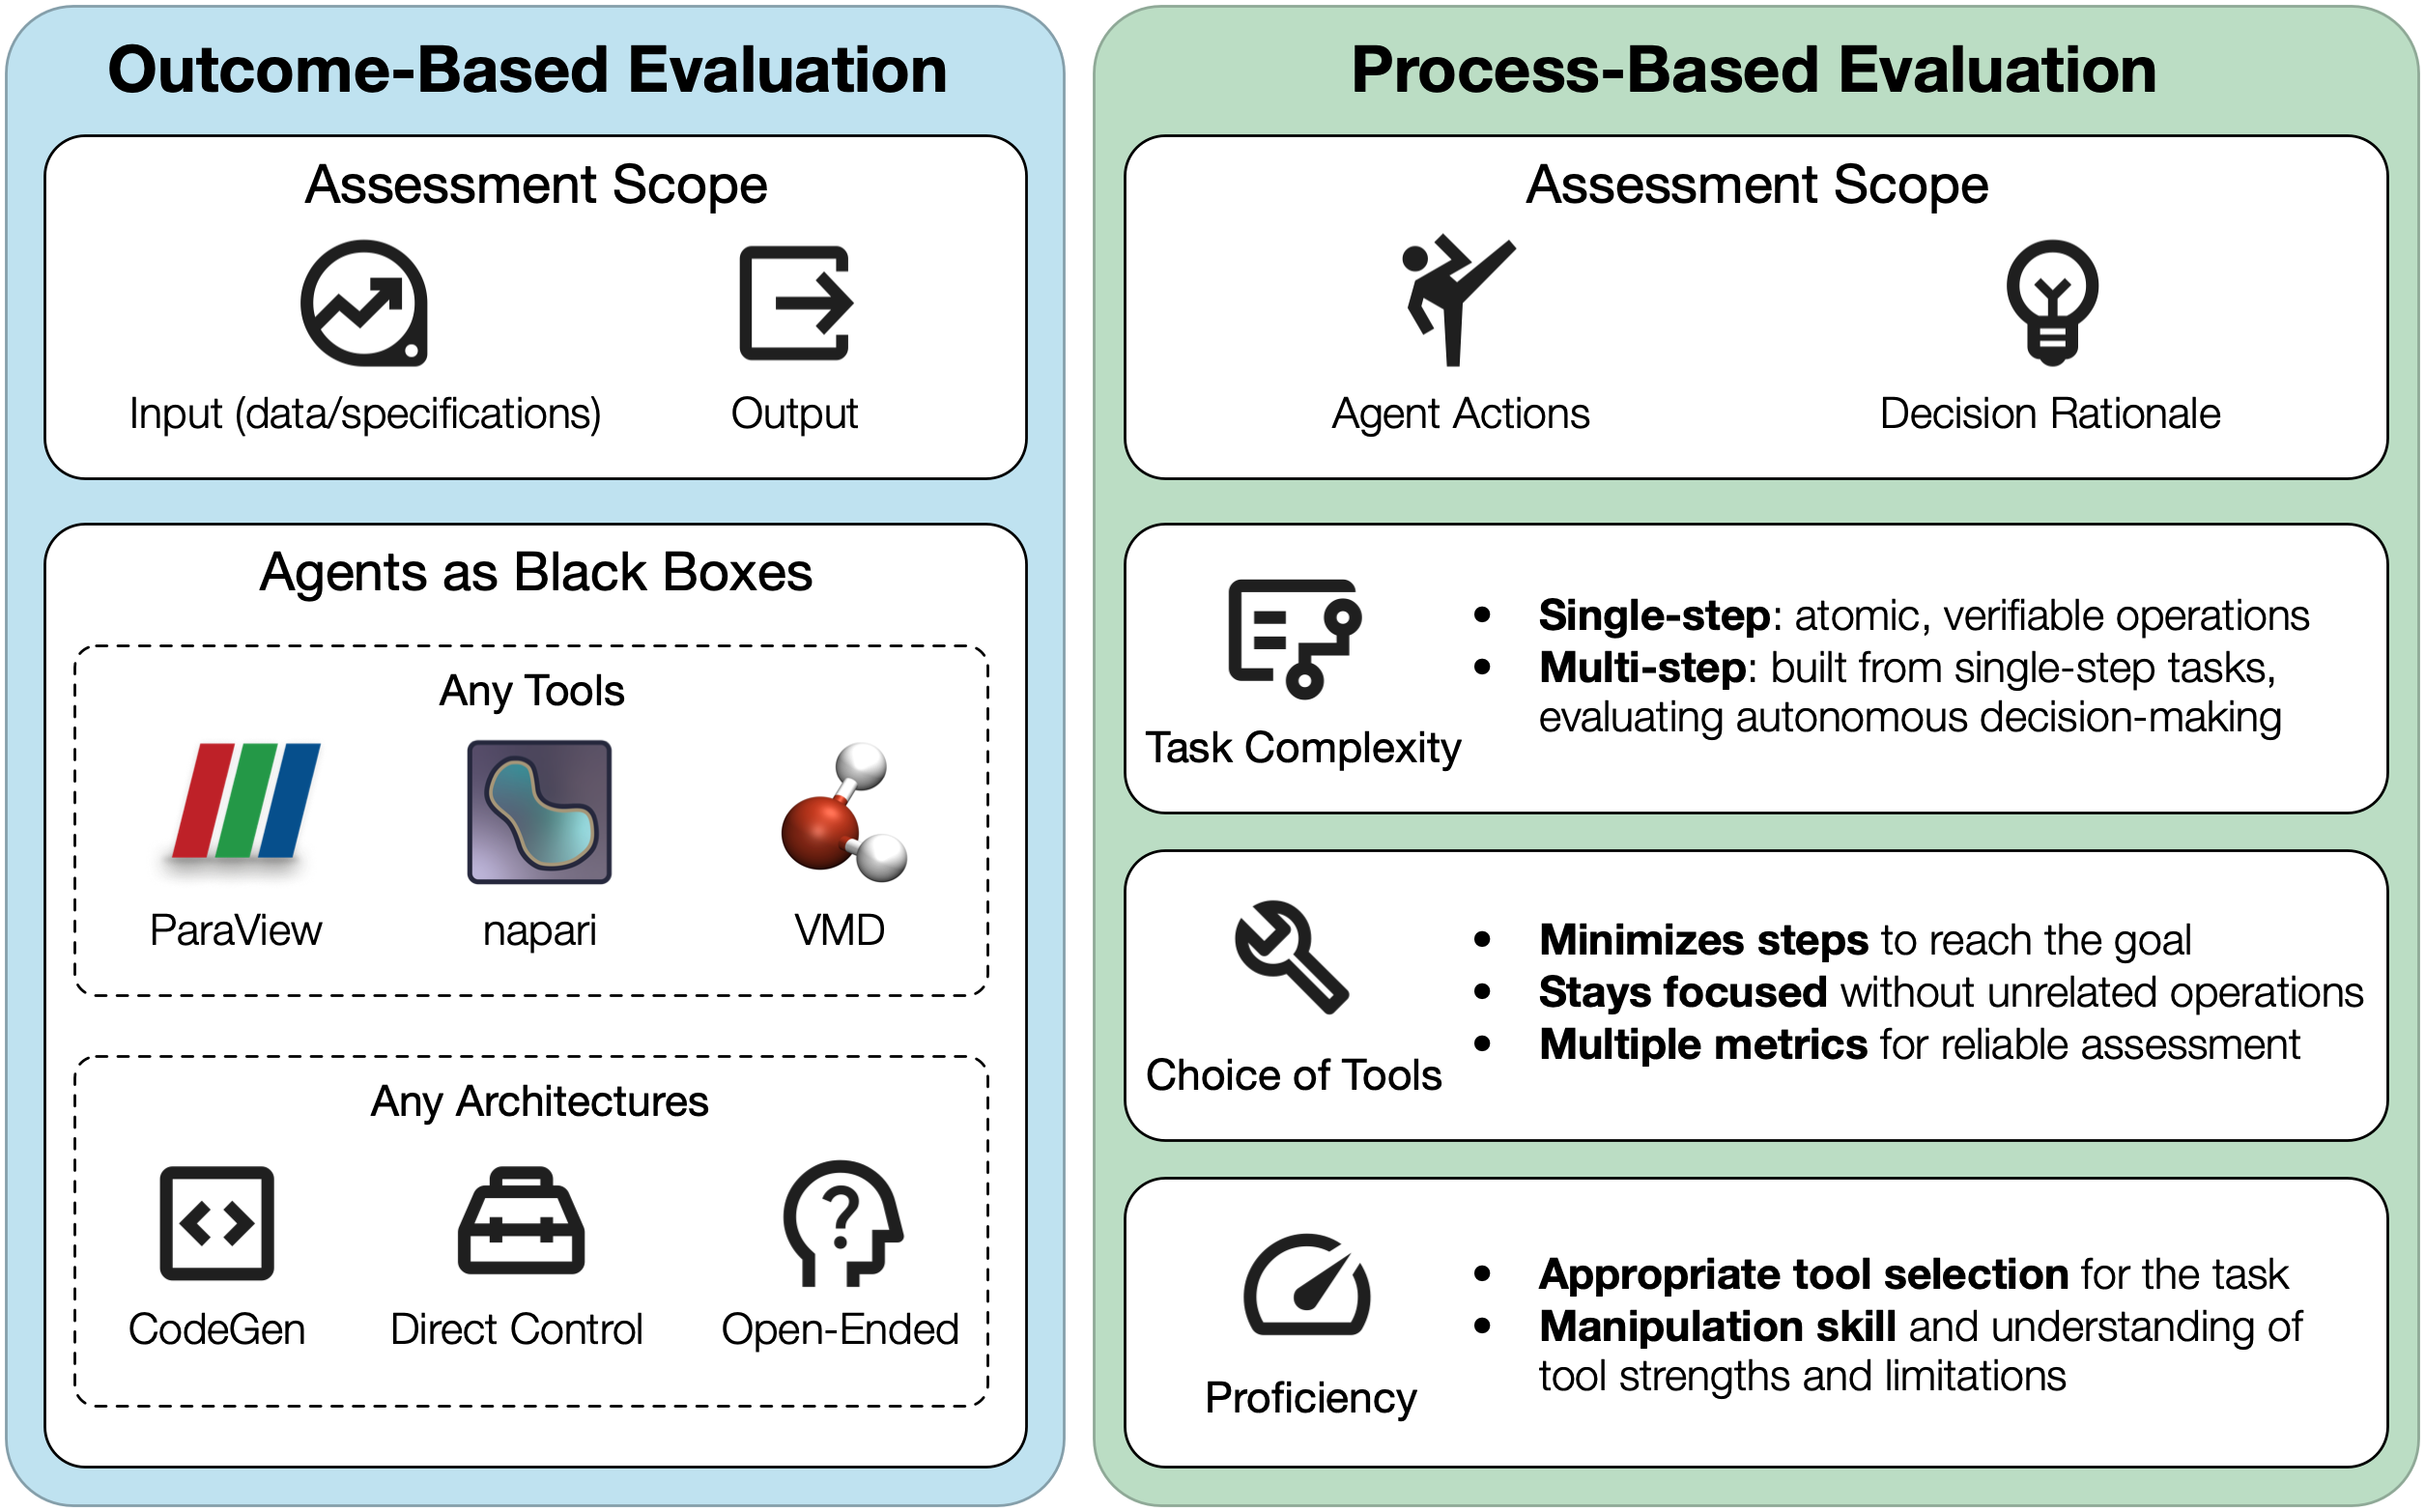
Taxonomy of SciVis agent evaluation, organized into two perspectives: outcome-based evaluation assessing the relationship between input specifications and final outputs while treating agents as black boxes, and process-based evaluation analyzing the agent's action path, decision rationale, and intermediate behaviors.

Why Contribute?

  • Help establish standardized evaluation metrics for visualization agents
  • Drive innovation in autonomous scientific visualization
  • Contribute to open science and reproducible research
  • Be recognized as a contributor to this community effort

Evaluation Taxonomy

Our benchmark evaluates agents across multiple dimensions including outcome quality, process efficiency, and task complexity. We combine LLM-as-a-judge with quantitative metrics for robust assessment.

See our GitHub repository for evaluation examples and deployment guides.

Team

The core team of this project is from the University of Notre Dame, Lawrence Livermore National Laboratory, and Vanderbilt University. Main contributors include Kuangshi Ai (kai@nd.edu), Shusen Liu (liu42@llnl.gov), and Haichao Miao (miao1@llnl.gov).